Football xG Statistics Spreadsheet
I’ve had a few questions on how to utilise the weekly spreadsheet. There are a thousand different possibilities but below are some key areas to think about. First I want to cover the important area of what the spreadsheet does not cover.
Areas not covered
The spreadsheet does not incorporate current team news, head to head history, manager changes, weather, psychological impacts of players saving themselves for a more important game next week etc etc.
The reason I am emphasising this first is to make the point that the spreadsheet is a great starting point for identifying games to bet on but is not the end point.

Importance of Value
The next point to mention is the importance of value. The majority of people will know the concept well. If ‘value’ is new to you, there are a thousand articles on the internet to provide more details. In simple terms, to make money consistently you should only bet where the odds being offered are greater than the chance of it happening e.g. if you’re offered 2.1 on a coin toss, you’d take it. If you’re offered 1.9 you shouldn’t bet. If you’re offered 2.0 (i.e. true odds of 50%) you should be indifferent as in the long-run you’ll break even.
Overview of the spreadsheet
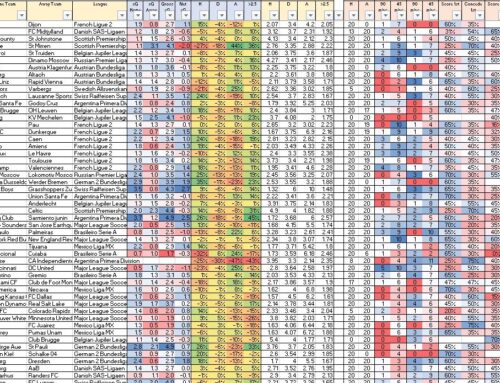
Each column in the spreadsheet is described in the ‘fields’ tab. To summarise, the spreadsheet consists of 2 key sections:
The first section shows the:
- xG Predicted:
This is the predicted chances and ultimately goals expected from the game. A key caveat that this is not a correct score prediction to back – the xG is a prediction based on the historical form. If the game was played a hundred times, on average this is what we expect the chances created to be i.e. the expected goals. Obviously every game is unique and history may not turn out to be a great prediction of the future.
- Odds vs Poisson:
This shows the current bookmaker odds at the time the spreadsheet was produced in the upper row, and the ‘value’ in the row below (a value greater than zero percent suggest there is value in the odds). For the example on the right, Holstein Kiel are showing 8% value (this is calculated as the Poisson model percentage of 35% shown on the far right of the spreadsheet minus the odds percentage of 27% (=1 divided by the odds of 3.7).


The second section shows:
- Historical statistics (averages are shown separately for the last 10, 5 and 2 games). The averages are based on home results for the team at home, and away results for the away team.
- Statistics are further separated into 1st half, 2nd half and Full game.
- The fields tab provide more details (largely the data is shown in terms of xG (expected goals based on the quality of chances) and GS/GA (actual goals scored and against).

How to use the spreadsheet
I suggest three ways:
-
Validate your opinions:
- For example, you have a strong belief a certain outcome will occur (e.g. Bayern will beat Dortmund) but you are not sure if the odds represent value. By looking at the spreadsheet you can quickly gain a good understanding if the odds being offered represent value. If not, the outcome may still occur but if you consistently bet without value you will lose money over the long term.
-
Start with the spreadsheet:
- Look at the spreadsheet and identify which games have a positive value in the ‘value vs poisson’ section i.e. the Poisson model % (vs) the bookmaker odds % shows a positive number. These are games which appear to show value in the odds. I suggest to look for a minimum of 5%. Similar, a value of less then -5% could be a laying opportunity.
- Consider what your risk appetite is for taking on high odds (i.e. there can be value in a 10/1 away team if the true odds are 7/1, but this still suggests the team will lose every 7 games). Make sure you are comfortable with this (please search the internet for articles on bank management and stake sizes i.e. you can still bet with value and go broke).
- For each of these games, consider the areas mentioned in the ‘areas not covered’ section above (Top tip: always look for a reason not to place a bet I.e. avoid confirmation bias).
-
In play trades:
- Use the in-play section of the spreadsheet to look for in-play opportunities. For example:
- Team A conceded first. In the last 10 games, once conceding first they only win 10% of their games. This could be a good opportunity to lay team A if the odds are remain value. Conversely, you may have backed team A before the goal – the stats can provide insight that it may be a good time to exit the trade.
- Team A and B both score a 2nd Half Goal in 90% of their games. If it’s half way through the second half, and the game looks open, then it could be a good time to back the overs.
- The key thing to note is that in-play trades should be treated no differently to pre-game trades (only enter the trade when the odds are showing value). Highlighting what are fair odds in-play is a future development project.
- Use the in-play section of the spreadsheet to look for in-play opportunities. For example:
This concludes the introduction to the spreadsheet. Any questions, feel free to reach out on Twitter or via the Contact form.