Expected Goals Table Ranks and Ratios Guide
Please see the video below and text summary. Let us know in the youtube comments which fields you’d like more details on.
Understanding Expected Goals Table Ranks and Ratios is key for developing profitable football betting systems. The video and summary breaks down the key columns from the xG Pro, xG Core and xG Free spreadsheets. These powerful tools simplify match analysis and help identify trading opportunities with minimal effort.
What Are Expected Goals (xG) Table Ranks?
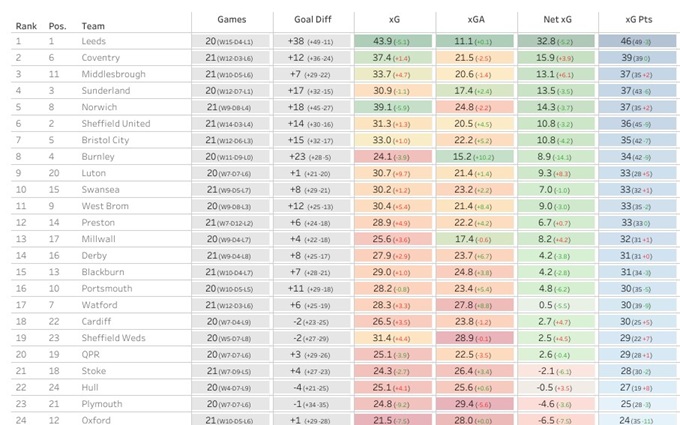
The xG ranks shown in the Pro, Core and Free spreadsheets are based on averages per game, which allows an easy and fair comparison between teams. For example, when this post was produced:
- Leeds were ranked 1st for xG created and 1st for xG against (i.e. best defense)
- Preston were 18th for xG created and mid-table for xG against
Games are also ranked by 1st Half and 2nd Half xG within the Pro, Core and Free spreadsheets, which is not available in the free xG League Tables.
Rank Ratios: How They Work
Rank ratios compare the attacking and defensive capabilities of both teams. They produce a value between +1 and -1, based on the following formula:
✅ Formula:
Rank Ratio = (Opponent Rank - Team Rank) / (Number of Teams - 1)Example:
- Leeds are ranked 1st for xG created
- Preston are ranked 13th for xG conceded
- Number of teams = 24
(13 - 1) / (24 - 1) = 0.5217A value closer to +1 means the team is more likely to score. A value closer to -1 suggests they are unlikely to score.
These values are calculated for:
- Full match
- 1st Half
- 2nd Half
Master Number: Where Goals Are Expected
The xG Master Number gives a simple way to identify goal-heavy or goal-shy matches.
✅ Formula:
Master Number = (Home Rank Ratio + Away Rank Ratio) / 2- A number close to +1 indicates both teams create and concede a lot of chances
- A number close to -1 indicates both teams struggle to create and concede few chances
Tip: Sort the table by Master Number to spot games likely to have lots or few goals.
Dominance Number: Who Will Control the Game?
The Dominance figure highlights likely one-sided matches.
✅ Formula:
Dominance = Home Rank Ratio - Away Rank RatioExample:
- Home Ratio = 0.52 (Leeds)
- Away Ratio = -0.74 (Preston)
0.52 - (-0.74) = 1.26- A value close to +2 = complete dominance by home team
- A value close to -2 = complete dominance by away team
Tip: Sort games by Dominance to find likely winners.
How to access the data?
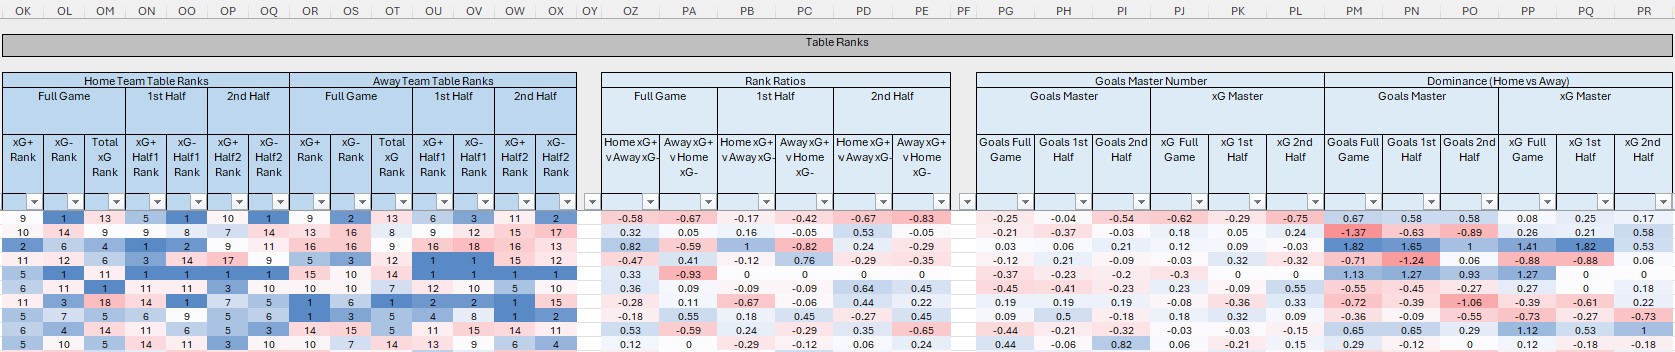
For xG Free and Core, the data is located in spreadsheet columns [OK] to [PR] as shown below. For xG Pro, the data is located in columns [VV] to [XC]. Examples of the spreadsheets are available at https://footballxg.com/members/.
Summary
The Expected Goals Table Ranks and Ratios allow you to:
- Quickly compare teams based on their table ranks
- Spot likely goal-fests or low scorers
- Identify strong betting edges using Master and Dominance numbers
This data is part of the exclusive xG Pro, xG Core and xG Free spreadsheets available at footballxg.com. Whether you’re a casual bettor or a professional trader, these tools can give you an edge.