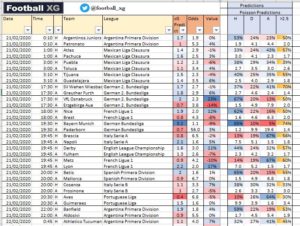
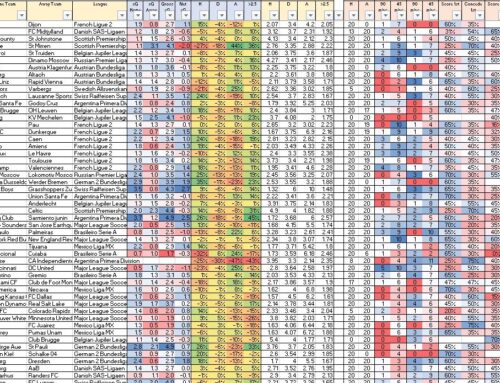
Updated for upcoming games.
[NOTE: I’ve had a few messages that early versions of excel are struggling to open the spreadsheet. Any problems, feel free to drop us a message through Twitter or the contact form]
Key stats include:
- Poisson model (based on Expected Goals and team strength) to help identify value in the match and Over 2.5 odds.
- Expected goal averages across 2, 5 and 10 games plus last 2 games averages regardless of whether the game was played home or away
- Actual goal averages split by 1st and 2nd half.
- Stats showing the team who scored or conceded first and then the outcome of the match and whether there were over 2.5 goals. A great tool for making quick in-play decisions and looking for value in the odds.
- Stats showing games where a second goal was scored within 10 minutes of the previous goal. This is useful in deciding whether to close out a position after a goal. The position can be opened once the odds have drifted allowing increased profits to be locked in.
- H2H results for the past 3 seasons: while there is much debate on how relevant head-to-head stats are, they can be used as a good sense check to eliminate potentially bad trades e.g. goals may look likely but due to local rivalry, previous H2H results have been low scoring.
**Spreadsheet link**: Footballxg.com – Last 2,5,10 Stats – 24 to 30 October 2020
Spreadsheet Guide: spreadsheet guide is available on the blog: spreadsheet guide
Poisson predictions v2.0: xG predictions are calculated based off xG, team strength, current form. A second model based on xG only is in the final columns (NB: just because there is value, it does not mean the team will win. The predictions do not take account of team news and should be used as a starting point for further analysis – see spreadsheet guide noted above).

