How to create a simple football power ratings and identify potential value
Following a recent Twitter Post, I have had multiple messages asking for more details on how to create a basic value model.
1/2: A well known football trading product salesman is about to sell value picks for the rest of the season based on his apparent bookmaker model! I’ve recreated it in 5 minutes…..it is as basic as model as you can get. Don’t waste your money.
— footballxg.com (@football_xg) December 16, 2020
While there are many methods (most a lot more advance than this), below is a simple well-publicised method (i.e. it is all over the internet. There is nothing proprietary about it and so there is no reason not to share it).
It simply involves creating individual team power/strength ratings off historical goals scored and conceded. These are then compared to league averages.
If that sounds too complicated, I have broken it down further below.
Here is one I made earlier
Before I get into the DIY approach, if it all sounds too complicated and you are desperate to part with your money, I have a ready-made version with all the bells and whistles (updated twice weekly and auto-generates fixtures) – please see the PROP page for more details.
Rather than spending your money, I do highly recommend people learn how to calculate the stats for themselves.
The DIY approach
The Home and Away Power Model (Based of Goals Scored and Conceded) is very straightforward.
Here is the link to the underlying excel sheet that is used in the calculations (excel sheet which includes the calculations and basic Poisson model).
1. Get game and odds data
- Obtaining individual games, scores and odds.
I have my own databases set-up which has made the below process a lot quicker. If you do not, there are some great free resources for obtaining game data. I highly recommend getting the excel data from https://www.football-data.co.uk/downloadm.php (I am not affiliated with the website in any way). I have included some example data in tab1 for the example below.
2. League Goal Averages
- Calculate league averages for goals scored and conceded over a period you decide. Leagues are usually fairly consistent (pre-covid!).
The more games you use, the less relevant it is e.g. calculating Shef Utd chance of winning based on last years form does not provide an accurate prediction. Similar, using too short a period and your averages may be swayed by one or two freak results.
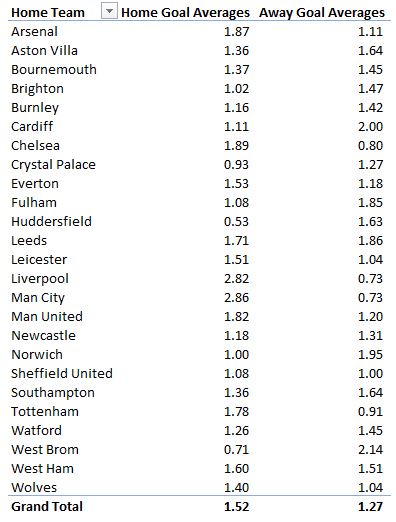
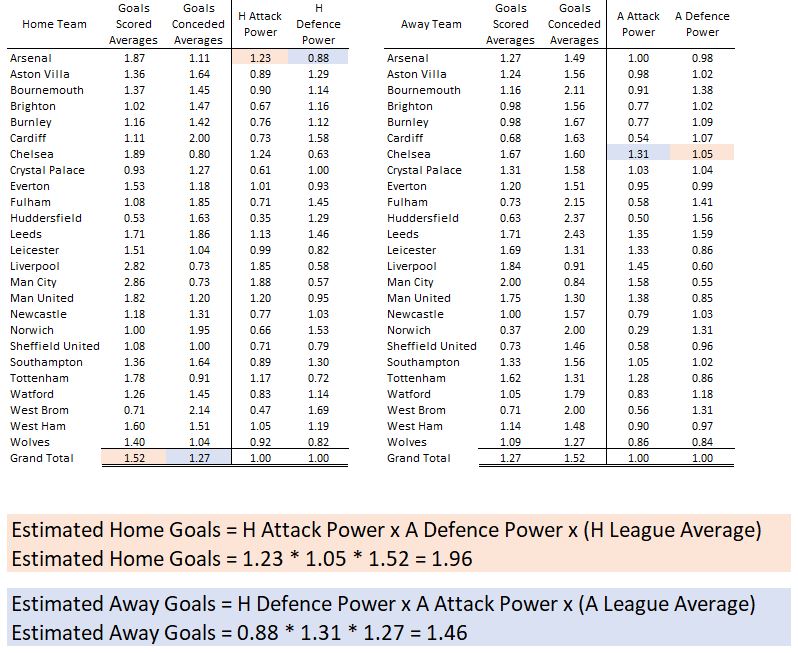
For purely example purposes I am using EPL games from 2018/19: Since the start of the 2018/19 English Premiership season until today (21Dec20), there has been 895 games played. There have been 1363 home goals and 1136 away goals. The average home goals have been 1.52 and away goals 1.27.
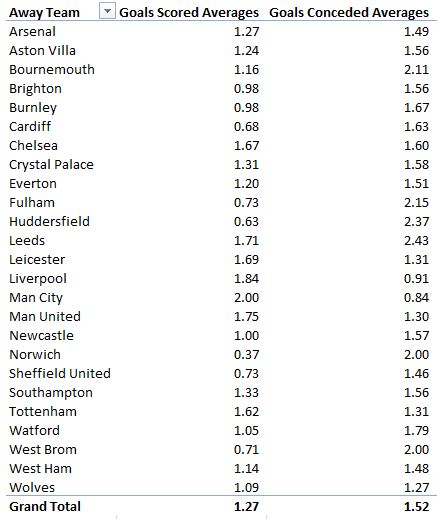
3. Team Goal Averages
- Do exactly the same as step 2, but do it on a team-by-team basis separately for both the home and away team.
Example: using a simple pivot table (screenshot below) or formulas (in the example spreadsheet) I’ve calculated the average goals scored and conceded when the team is at home. I then did exactly the same for the away team.
You will also see the overall averages at the bottom of the pivot table are the same as the overall league averages calculated in step 2.
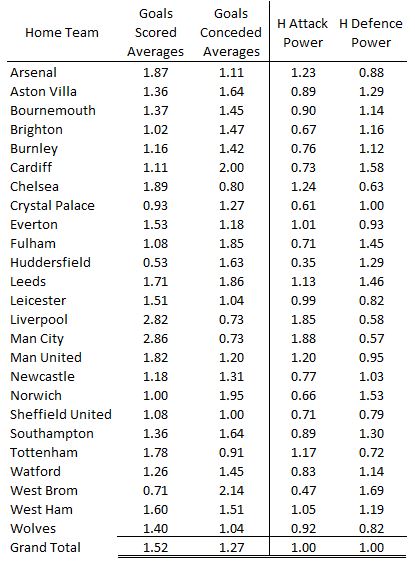
4. Attack and Defence Strength
- From here you can calculate an attack and defence power/strength rating by team when they are playing at home. You repeat the process for when they are playing away. This is simply done by dividing the team averages scored by the league averages.
Example: Arsenal’s averaged 1.87 goals at home versus the league average of 1.52. Dividing 1.87 by 1.52 provides a H Attack Power rating of 1.23. Anything greater than 1 equals a team that scores more than the league average. Greater than 1 for defence power means they concede more than the league average.
5. Estimated Score
- From these strength numbers in step 4, an estimated score can be calculated for any individual game.
This is simply looking at how well the home team attack (versus league averages) stacks up against the opposition defence (versus league averages). A separate calculation is done for both the home and away goals.
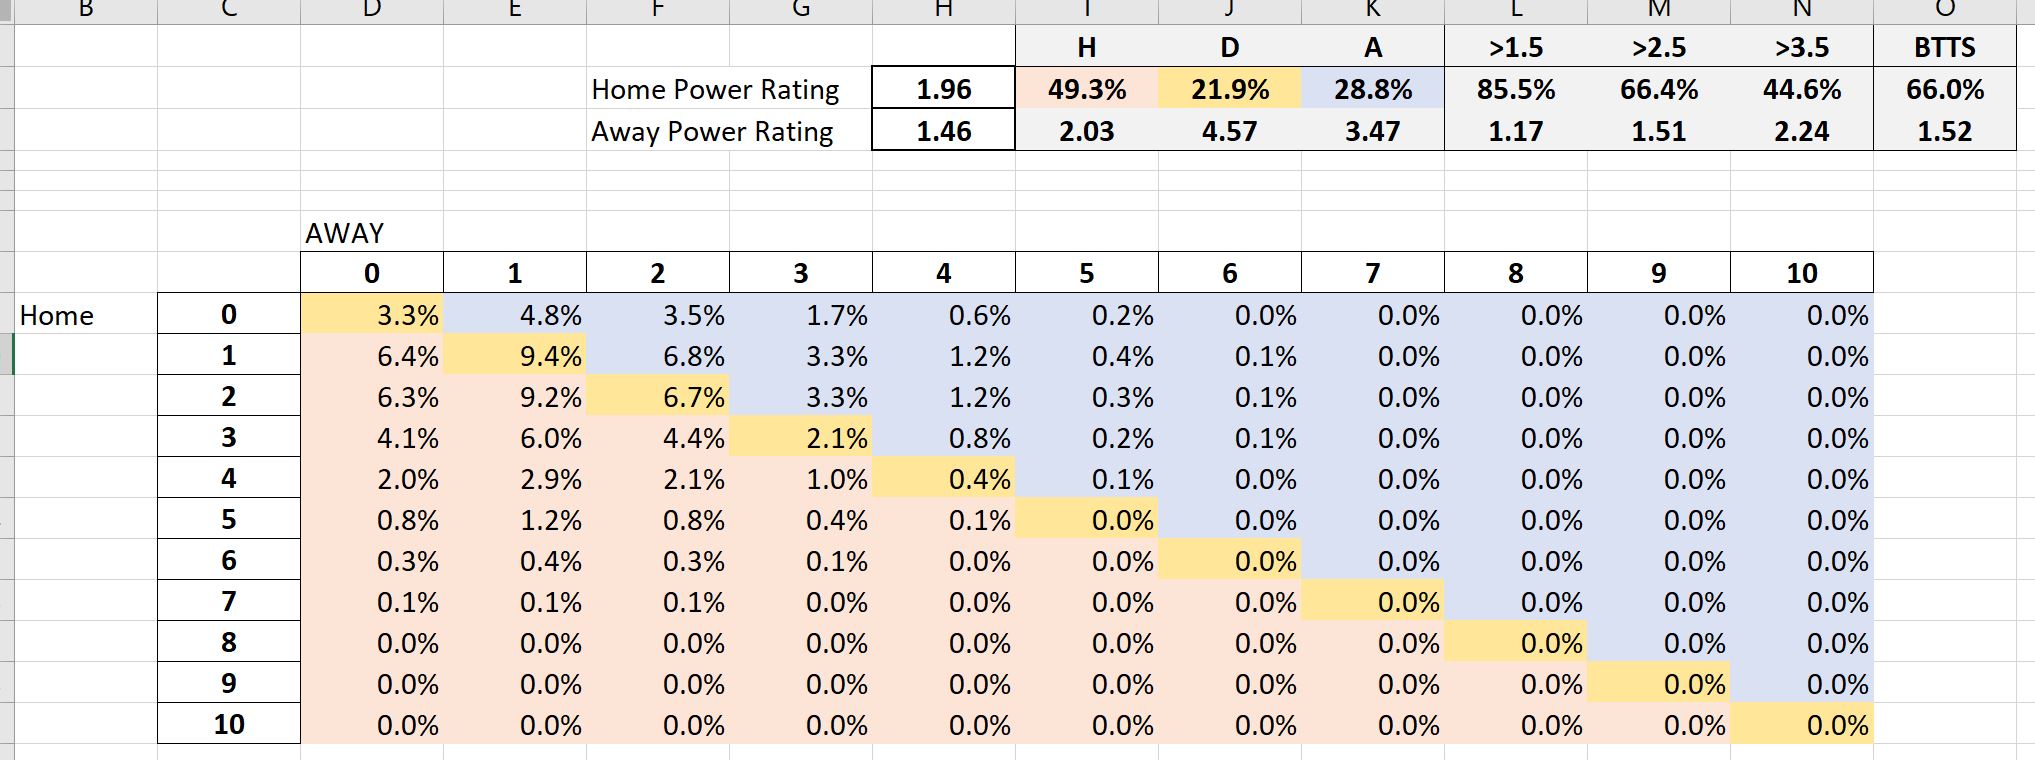
1.96 goals?
- It is impossible to score 1.96 goals
As you can see, this suggests Arsenal should score 1.96 goals and Chelsea should score 1.46 goals. As you can not score .96 or .46 of a goal, this makes it difficult to assess what the actual chance of an Arsenal win is based on the scores calculated above.
This is where things get more complicated, but I will try to keep it simple.
Poisson Model
- Converting decimal goals to actual outcomes
A Poisson model can be used to turn estimated decimal goals into actual percentage chances of a win. This is based on the assumption that football match scores follow the Poisson distribution. In reality, Poisson underestimates draws and overestimates away wins (these can be adjusted for with more advanced Poisson models).
By plugging the numbers into a simple Poisson excel model (see tab in provided spreadsheet) you can get a full matrix of score lines that adds up to 100%.
Then simply adding the individual scorelines you can calculate an estimate of the home win/draw/away win chance.
In the example above, this suggests Arsenal have a roughly 49% chance of wining the game based on historical performances over the last 2 and a bit seasons.
Limitations
Arsenal having a 49% chance against Chelsea should start the alarm bells ringing!!!! The method assumes that teams play to their historical averages. In reality, teams go through spells of good and bad form. Arsenal historically were good at home but recently Arsenal are in a bad run of form. Similar, Chelsea conceded lots of goals but recently Chelsea are in a good run of form and have tightened up their defence. The actual chances of Arsenal winning will be lower than 49%. At the time of posting this, their odds are 4.0 giving them a 25% chance of winning the match.
Some people will claim there is huge value on Arsenal. They are wrong! I’ll caveat that there may still be value on Arsenal, but using this tool alone will not show you if there is true value.
Also, as stated above, the basic Poisson model does not fully reflect the score distributions of any particular league which also results in misleading calculations.
So what next?
Learning this provides a basic understanding of how to come up with prices and odds. To get a more accurate model, you need to model a lot more variables and over a shorter period of time and use a more accurate model than the basic Poisson model.
This is what I do on other parts of the wesbsite (using xG data rather than actual goals data) but it is an ongoing battle due to 2 reasons:
- The bookmakers (and the agencies they outsource to) and the large syndicates have very sophisticated models which accurately price up the initial markets.
- Largely due to syndicates highlighted in point 1 and other smart money, if the markets are showing an inefficiency in a particular game the money will flow to that price, and the odds will move until the pricing inefficiency disappears. As such the closer you get to kick-off the more efficient the prices are (as they start to reflect team news etc). The prices at kick-off are deemed to be the most efficient and fairly reflect the true chance of either team winning (the bigger the league, the more money bet = the more efficient the price).
So how do I make money?
In simple terms, it is difficult to be profitable due to the overround that is priced in (basically the profit margin the bookmakers and exchanges add).
As stated above, the most efficient price is the time at kick-off. If you can get on at odds greater than the kick-off price on a regular basis, then in the long-run you should be profitable.
This is what I am trying to do with my website. More sophisticated models and better guidance are being developed and hope to be released in the New Year.
Questions?
I put this together quickly so I am sure there are areas that needs explaining better above. Feel free to reach me on Twitter or the contact page if you have any question on the above.
As mentioned at the start, anyone desperate to spend money I will happily sell anyone a polished model along with odds averages for far less than anyone else is charging – see PROP model page for further details.