Updates
22Jan: Updated for weekend fixtures. 25th Jan: updated for midweek games.
Please note the following changes which impact the layout of the xG stats spreadsheet:
- An extra column has been added at the start of the spreadsheet (this provides a unique link per game to allow easier filtering by game).
- Under 2.5 stats in the 2,5,10 full time stats has been replaced with ‘Win to nil’ stats.
- The Dutch model has been updated. The predictions have changed from those posted earlier today.
A) xG Stats Spreadsheet
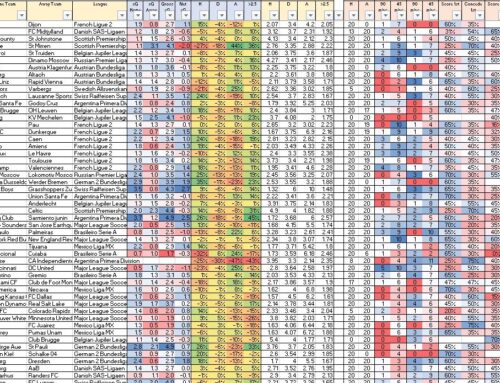
Changed Layout: Excel file download link: Footballxg.com – Last 2,5,10 Stats – 23 to 29Jan 2021.xlsx
Spreadsheet compatible with Excel 2010 or later (Excel 2007 users please click here).
*NEW*: JPEG version of spreadsheet available for easier viewing on mobile phones (NB: download the file after clicking on the link): JPEG Screenshot link (5MB)
Key stats include:
- Poisson model (based on Expected Goals and team strength) to help identify value in the match and Over 2.5 odds.
- Expected goal averages across 2, 5 and 10 games plus last 2 games averages regardless of whether the game was played home or away
- Actual goal averages split by 1st and 2nd half.
- Stats showing the team who scored or conceded first and then the outcome of the match and whether there were over 2.5 goals. A great tool for making quick in-play decisions and looking for value in the odds.
- Stats showing games where a second goal was scored within 10 minutes of the previous goal. This is useful in deciding whether to close out a position after a goal. The position can be opened once the odds have drifted allowing increased profits to be locked in.
- H2H results for the past 3 seasons: while there is much debate on how relevant head-to-head stats are, they can be used as a good sense check to eliminate potentially bad trades e.g. goals may look likely but due to local rivalry, previous H2H results have been low scoring.
Spreadsheet Guide: spreadsheet guide is available on the blog: spreadsheet guide
Poisson predictions v2.0: xG predictions are calculated based off xG, team strength, current form. A second model based on xG only is in the final columns (NB: just because there is value, it does not mean the team will win. The predictions do not take account of team news and should be used as a starting point for further analysis – see spreadsheet guide noted above).
B) PROP Model
This was created after a rival website was selling something very similar for around £300. More details can be found below:
Page link: Power Rating and Odds Profitability (PROP) Model
Stats include:
- Team power ratings based on historical goals (NB: this is not based on xG).
- Power ratings then converted to odds to look for potential value in games.
- Profitability by teams and leagues when odds fall within ranges of the current Home and Away Odds Prices.
- Data updated twice a week including provisional odds for the upcoming games (odds can then be manually overridden as needed).
- Beginner Poisson model also included.