Big Changes Coming
xG spreadsheets on the blog will be replaced by xG Free from next season – includes an improved xG model (better historical profitability) and an improved one-line layout for easier filtering (all the top European leagues will continue to be provided for FREE with no subscription or registration necessary). There will be an additional 2 subscription options – the first will provide all the historical data to allow people to back-test various strategies and a couple of additional leagues. The second, provides additional statistics and, if there are enough people interested, will provide a significant increase in the the number of leagues covered. More details coming soon.
Update Schedule
21May: Updated for weekends games. 28May 4pm: Update for next weeks games.
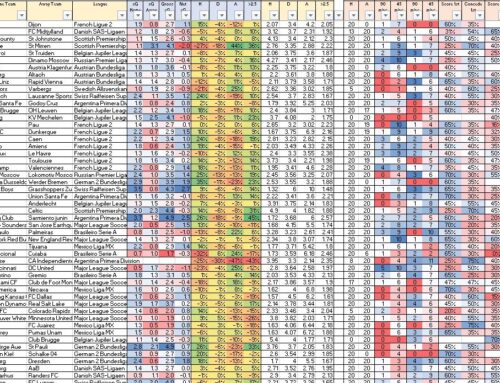
A) xG Stats Spreadsheet
**NEW Version** Excel file download link: xgFree (redirects to current week’s games)
**Old Version** Excel file download link: Footballxg.com – Last 2,5,10 Stats.xlsx
Please note that the new version is based off a different calculation of xG Predict which result in different outputs from the Poisson Model i.e. the +- value numbers will be different in the 2 versions above. An explanation of the changes to the models is below and I’ll emphasis the xG Blend Predict and Poisson model output shows superior backtesting profits when compared to the original M1 model:
| Blend: xG Predict | New xG Prediction included in xG Free and Core (a blend of 3 different models below – M2,X2,X10) |
| M1: xG Predict | Original xG Model – based on actual goals, expected goals, team strength and a number of additional inputs. |
| M2: xG Predict | Included on original xG blog spreadsheets (far right columns) – Model based on expected goals, team strength and a number of additional inputs. |
| X10: xG Predict | New model based on expected goals over the medium term. |
| X2: xG Predict | New model based on expected goals over the short term. |
Key stats include:
- Poisson model (based on Expected Goals and team strength) to help identify value in the match and Over 2.5 odds.
- Expected goal averages across 3, 5 and 10 games plus last 3 games averages regardless of whether the game was played home or away
- Actual goal averages split by 1st and 2nd half.
- Stats showing the team who scored or conceded first.
Spreadsheet Guide: spreadsheet guide is available on the blog: spreadsheet guide. Spreadsheet compatible with Excel 2010 or later (Excel 2007 users please click here).
Predicted xG (advanced xG Poisson Model): xG predictions are calculated based off xG, team strength, short and medium term form. (NB: just because there is value, it does not mean the team will win. The predictions do not take account of team news and should be used as a starting point for further analysis – see spreadsheet guide noted above).
B) PROP Model
This was created after a rival website was selling something very similar for around £300. More details can be found below:
Page link: Power Rating and Odds Profitability (PROP) Model
Stats include:
- Team power ratings based on historical goals (NB: this is not based on xG).
- Power ratings then converted to odds to look for potential value in games.
- Profitability by teams and leagues when odds fall within ranges of the current Home and Away Odds Prices.
- Data updated twice a week including provisional odds for the upcoming games (odds can then be manually overridden as needed).
- Beginner Poisson model also included.
- **New** xG Blend model predictions for relevant leagues included within the spreadsheet.